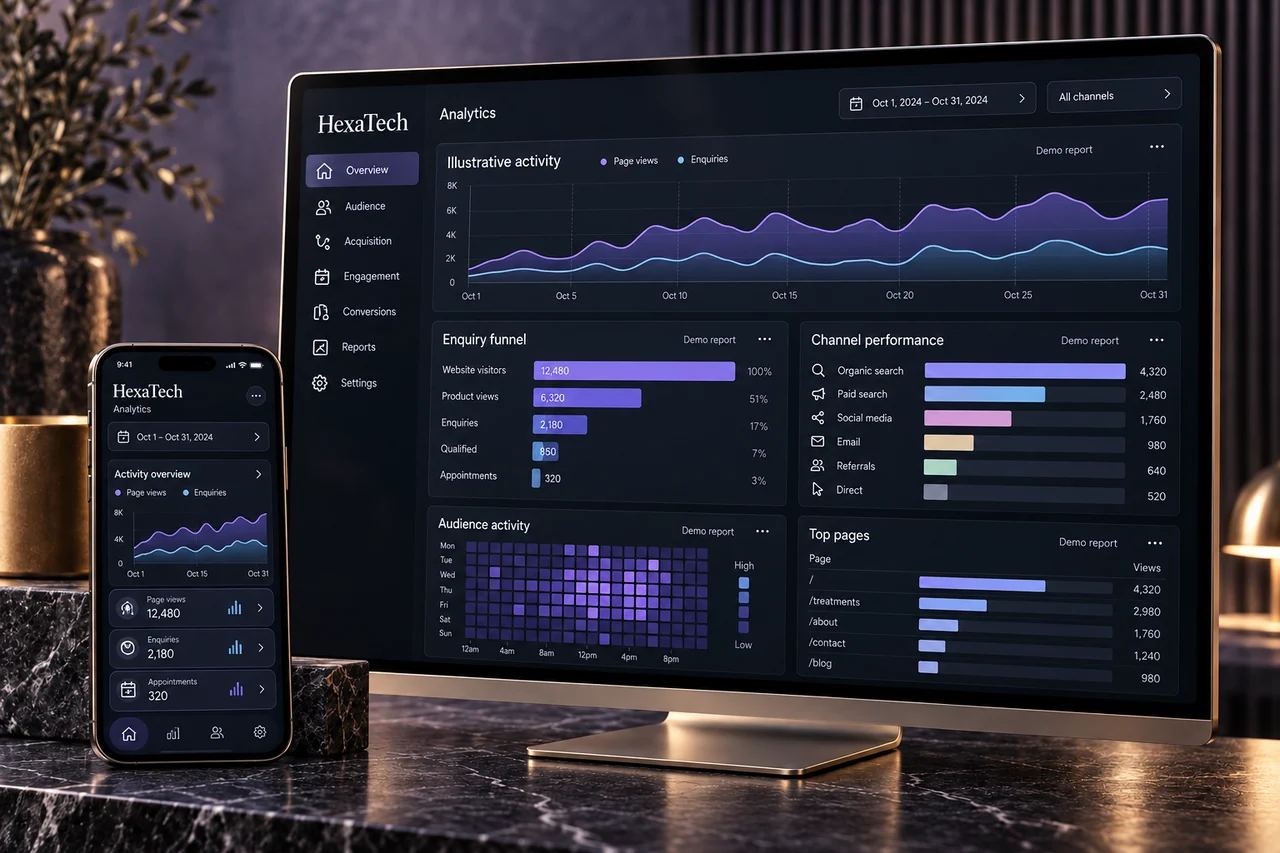
01 / Activity & decisions
See the signal.
Choose the next move.
A reporting view across customer activity, bookings, conversations and retention.
Explore the project (opens in a new tab)The work & value02Potential at a glance
Released hours / month
Monthly capacity value
12-month value after costs
Capacity-value payback
03Challenge & solution
Every detail.
One business goal.
Separate tools produce separate reports. The useful question is how the customer journey is working and where the team should look next.
Customer and operational signals become easier to read beside the decision they should inform.
- 01
Ask an operating question
Enquiry, booking and relationship signals are grouped around what a business needs to understand. The view gives context to a number instead of assuming that more data is automatically useful.
- 02
Make the movement explainable
Funnels and periods help the team investigate where the journey changes. Source and cohort thinking separate new demand, returning customers and differences between channels.
- 03
Turn insight into work
The next step is a decision, investigation or owned action. The interface keeps that connection visible so reporting can support improvement rather than end as an exported document.
- 04
Measurement design
Define the question, metric and denominator.
04Business value
Modelled impact.
Released capacity
25hReleased hours / month
Time per reporting cycle
50% lessMinutes per task
Capacity value
£755Monthly model
The operating journey
6Changes tested
Capacity value / investment
158.9%12-month model
Time allocation
50%Released capacity
- Released time50%
- Remaining handling50%
Value after all modelled costs
£5,560Initial investment included
05The experience
From observe
to act.
Customer and operational signals become easier to read beside the decision they should inform.
Measurement design
Define the question, metric and denominator.
Data communication
Use charts that make differences understandable.
Experiment design
Connect an insight with a test and accountable action.


06The connected journey
From first intent
to useful action.
01Observe
Bring the relevant signals together.
02Compare
Review periods, sources and customer groups.
03Investigate
Locate the workflow behind a change.
04Act
Give the next test or task an owner.
07Technology & expertise
Built to
keep improving.
Product UX
An experience shaped around the user.
Business context
Information the team can maintain.
Connected workflows
People, records and the next action.
Measurement
Useful signals with clear definitions.
Human oversight
Review, ownership and operational judgement.
Enquiry funnel
See the steps between a conversation, engagement and captured contact details.
Conversation activity
Review volume and patterns across the selected reporting window.
Entry-page insight
See which website pages bring visitors into the assistant.
Time patterns
Review activity by hour and day to understand when customers engage.
Human & AI handling
Understand the distribution of conversations handled by the assistant and team.
Review in context
Use the reports alongside the underlying customer and conversation records.
Watch the product walkthrough
08Let's do this
What could we
build for you?
Bring us the business challenge. We’ll connect the strategy, experience and working product around it.